Prepares a by Group Violin Graph
prepare_by_group_violin_graph.RdReads a data frame containing a grouping factor and a numerical variable and plots a series of violin graphs by the grouping factor.
prepare_by_group_violin_graph(
  df,
  by_var,
  var,
  order_by_mean = FALSE,
  group_on_y = TRUE,
  ...
)
Arguments
| df | Data frame containing the grouping factor and the numerical variable to be plotted |
|---|---|
| by_var | a string containing the column name of the grouping factor |
| var | a string containing the column name of the numerical variable |
| order_by_mean | a logical value indicating whether you want your violins to be ordered by group means (defaults to FALSE) |
| group_on_y | a logical value indicating whether you want your violins to be oriented horizontally (defaults to TRUE) |
| ... | additional parameters that are passed to
|
Value
The plot as returned by ggplot2
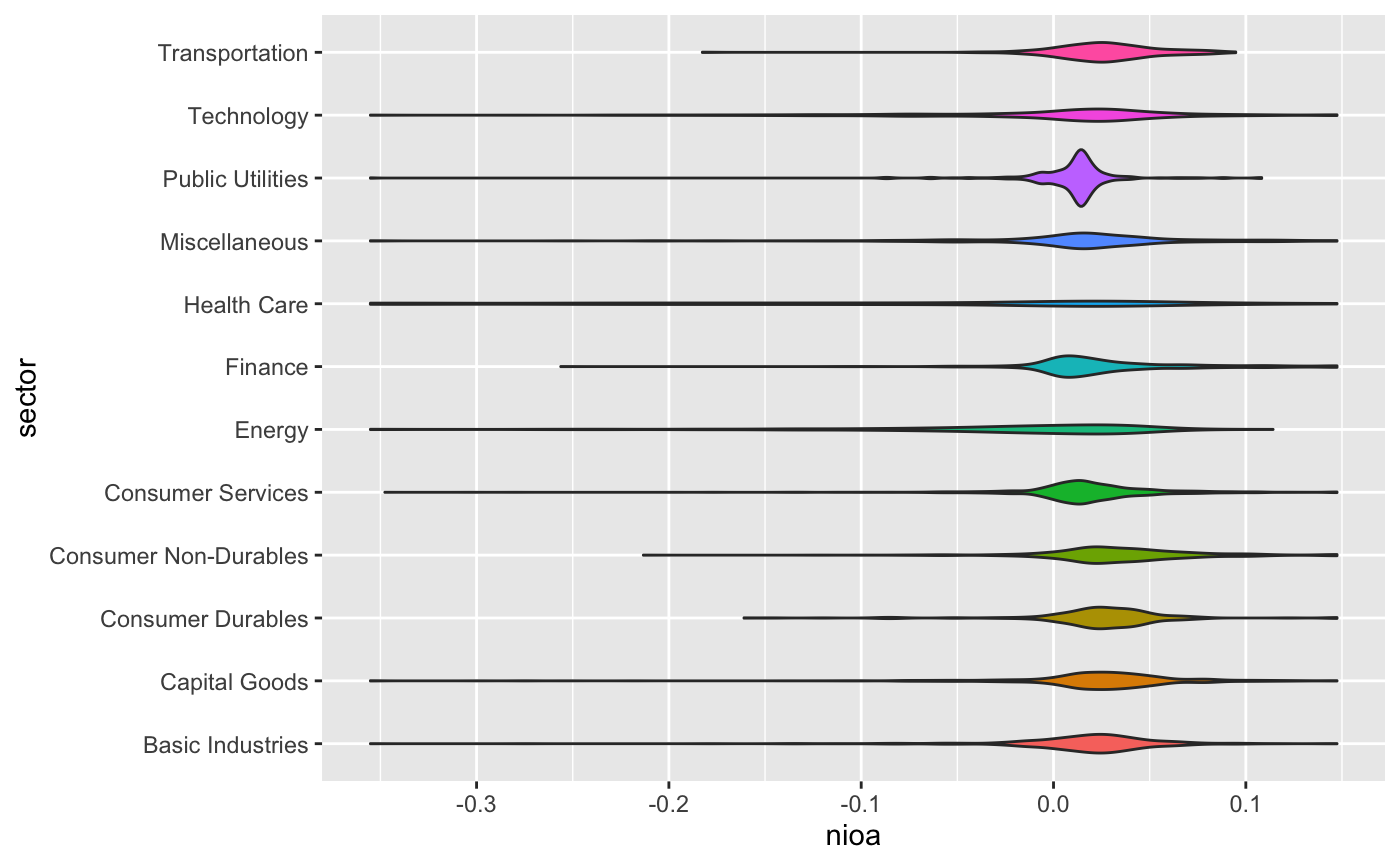
Examples
data(russell_3000)
df <- treat_outliers(russell_3000)
prepare_by_group_violin_graph(df, "sector", "nioa")