Reads a data frame containing a grouping factor and a numerical variable and plots a bar graph of a given statistic of the variable by the grouping factor.
Usage
prepare_by_group_bar_graph(
  df,
  by_var,
  var,
  stat_fun = mean,
  order_by_stat = FALSE,
  color = "red"
)
Arguments
- df
Data frame containing the grouping factor and the numerical variable to be plotted
- by_var
a string containing the column name of the grouping factor
- var
a string containing the column name of the numerical variable
- stat_fun
a function to be called on the numerical variable. Will be called with
na.rm = TRUEto ignore missing values- order_by_stat
a logical value indicating whether you want your bars to be ordered the value of the statistic (defaults to FALSE)
- color
bar color
Value
A list containing two items:
- "df"
A data frame containing the statistics by group
- "plot"
The plot as returned by
ggplot
Examples
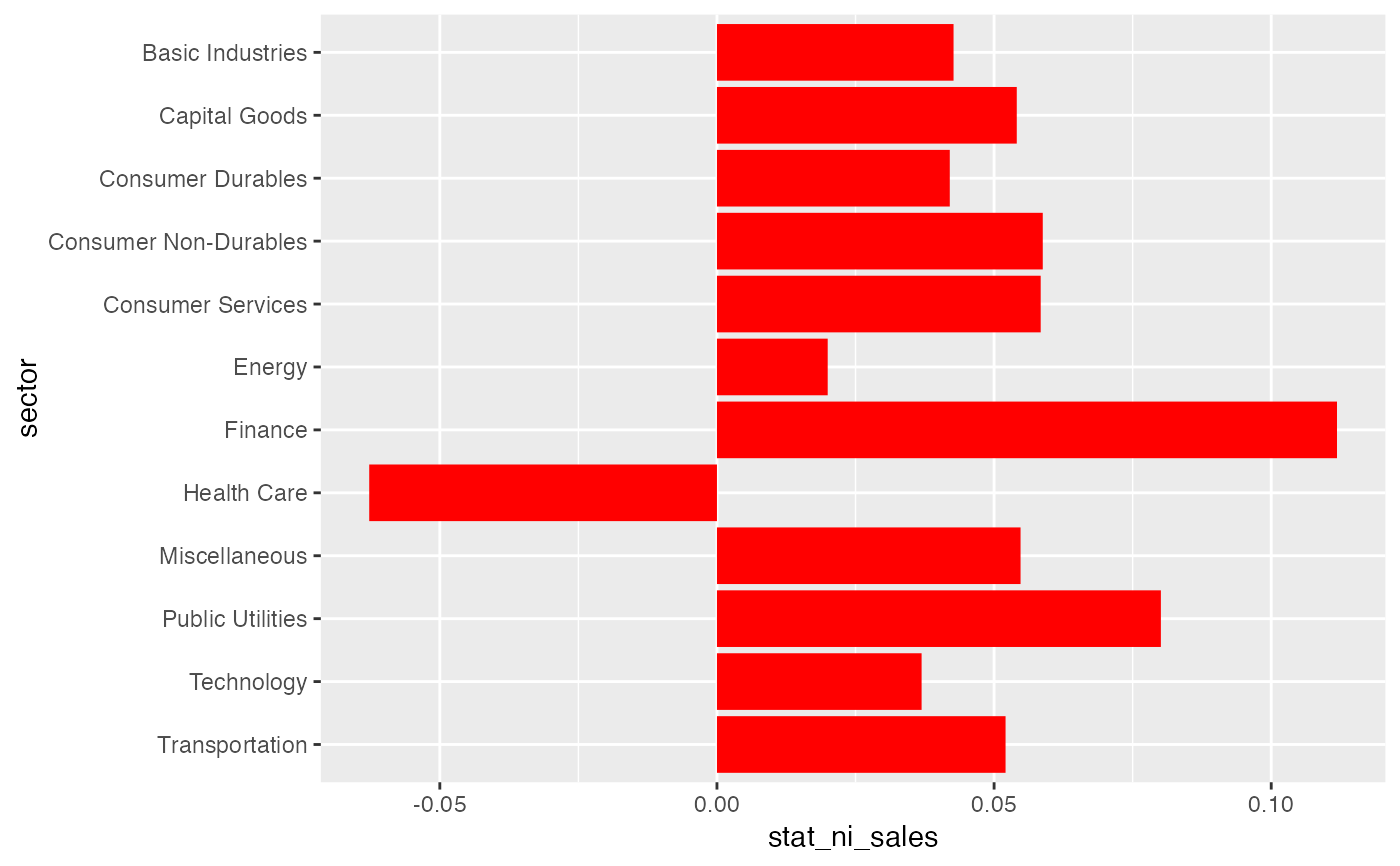
data(russell_3000)
graph <- prepare_by_group_bar_graph(russell_3000, "sector", "ni_sales", median)
graph$plot