Prepares a By Group Trend Graph
Source:R/prepare_by_group_trend_graph.R
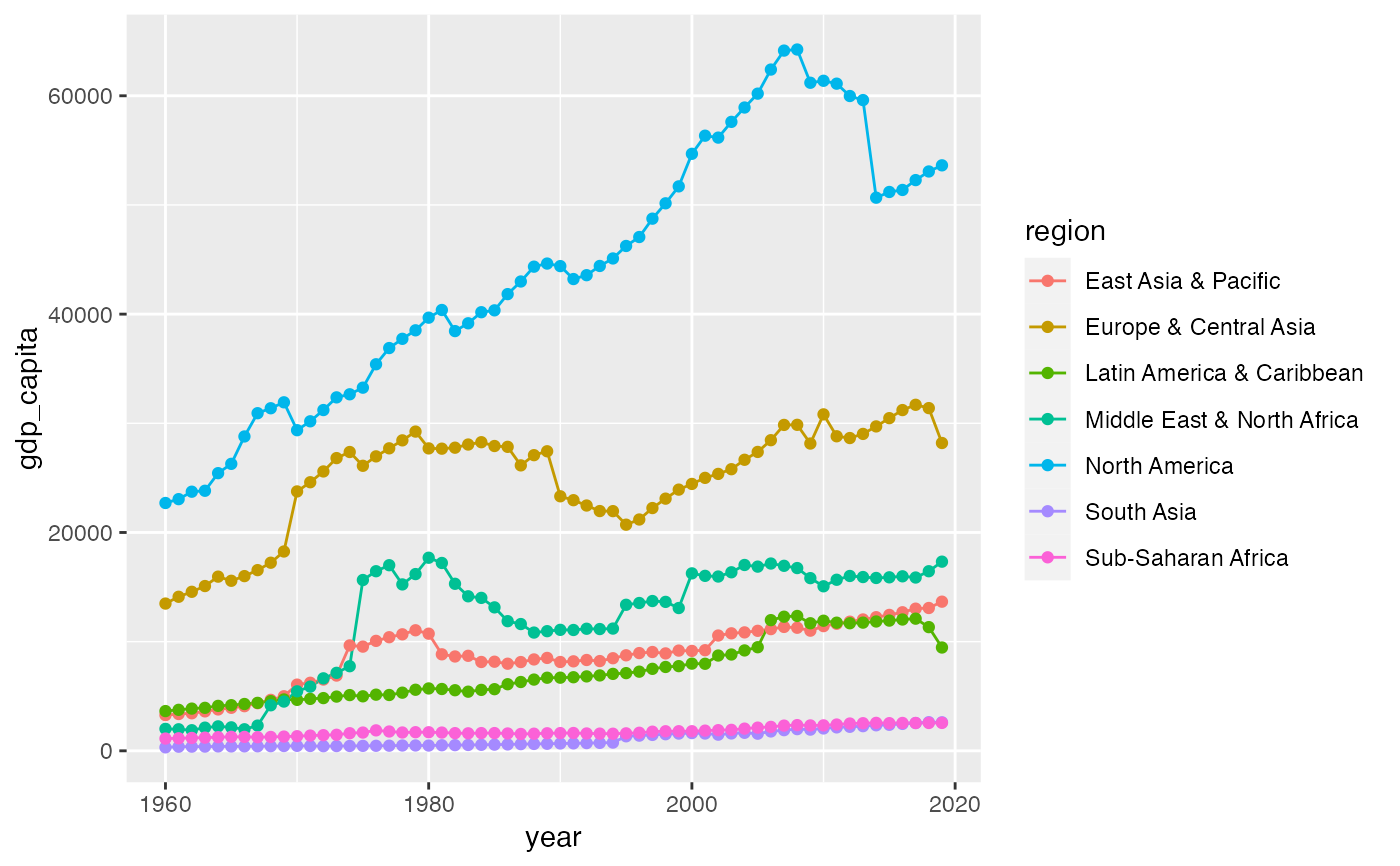
prepare_by_group_trend_graph.RdReads a data frame and line plots the selected variables (which need to be numeric) by group and an ordered factor (normally the time-series indicator).
Arguments
- df
Data frame containing the ordered factor and a set of numerical variables to be plotted.
- ts_id
a string containing the column name of the ordered factor (normally the time-series indicator).
- group_var
a variable coercible into a factor to group the data on.
- var
The name of the variable that you want to plot.
- points
Do you want points to indicate the observations? Defaults to
TRUE.- error_bars
Do you want error bars to be plotted? Defaults to
FALSE.