Prepares a Graph Displaying Missing Values in Panel Data
Source:R/prepapre_missing_values_graph.R
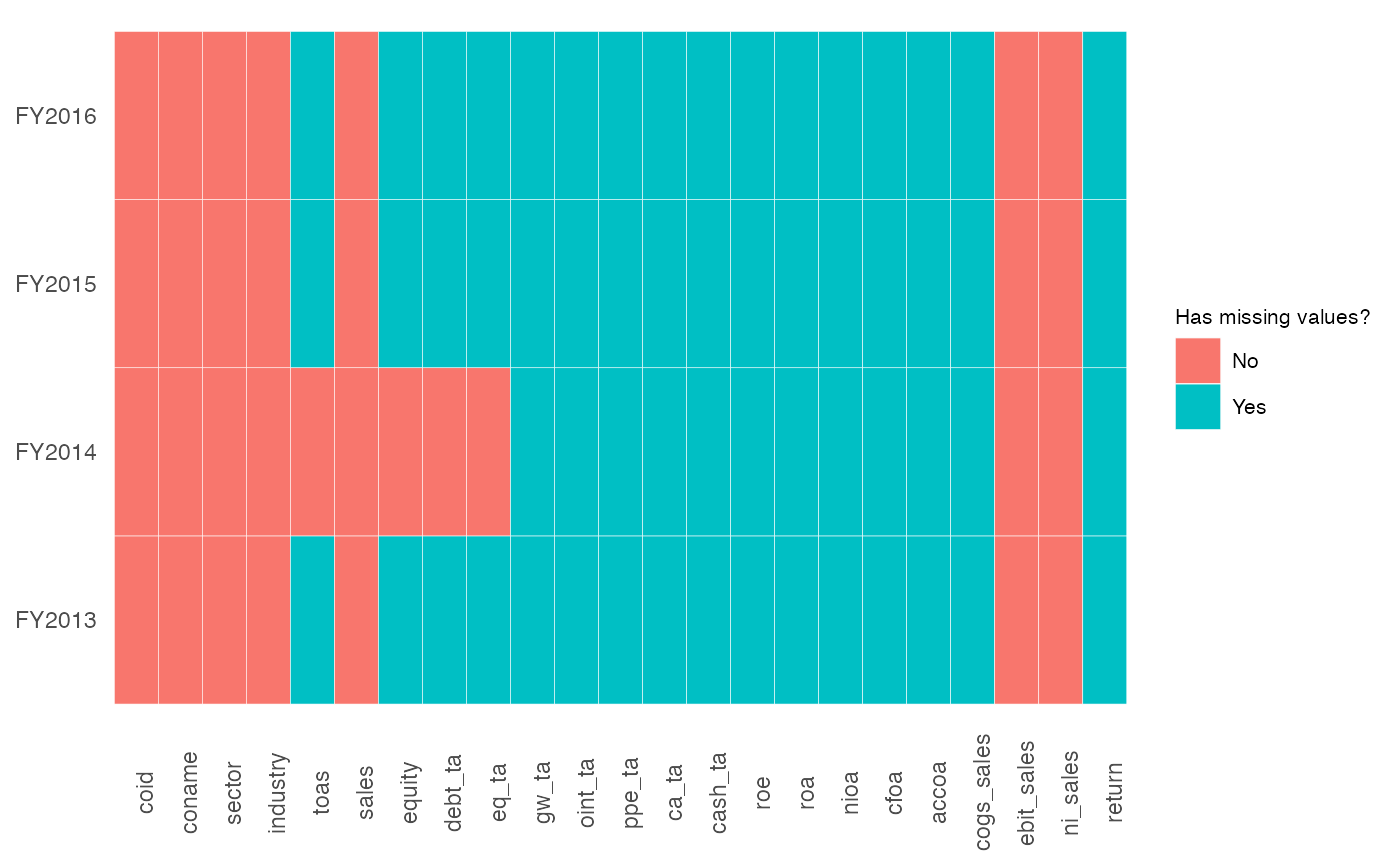
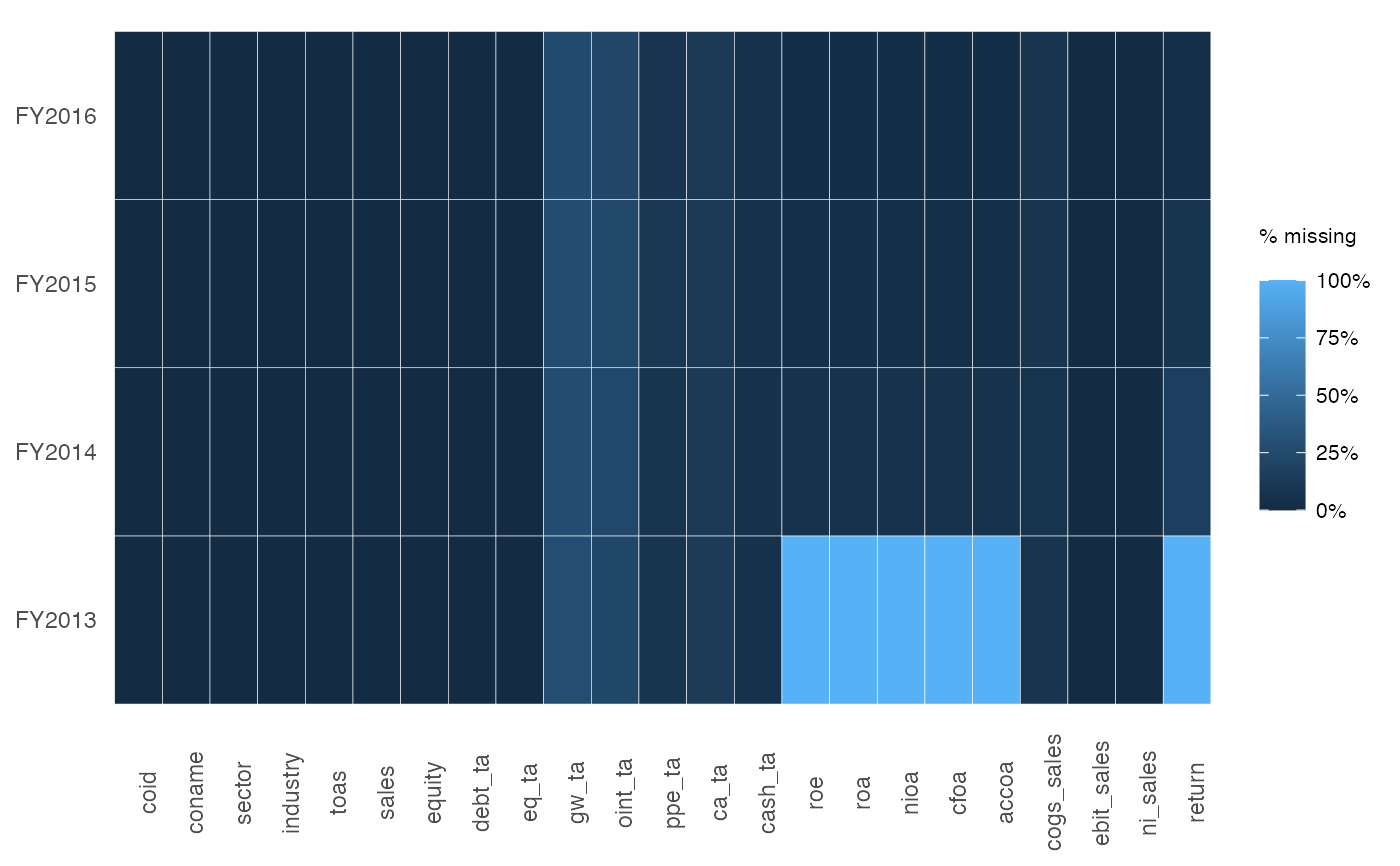
prepare_missing_values_graph.RdDisplays a heatmap of missing value frequency across the panel
Arguments
- df
Data frame containing the data.
- ts_id
A string containing the name of the variable indicating the time dimension. Needs to be coercible into an ordered factor.
- no_factors
A logical value indicating whether you want to limit the plot to logical and numerical variables. Defaults to
FALSE.- binary
If set to
TRUE, the plot uses a binary scale only high-lightening whether values are missing or not. Defaults toFALSE.
Details
This was inspired by a blog post of Rense Nieuwenhuis. Thanks!
Examples
prepare_missing_values_graph(russell_3000, ts_id="period")
#> Warning: `gather_()` was deprecated in tidyr 1.2.0.
#> ℹ Please use `gather()` instead.
#> ℹ The deprecated feature was likely used in the ExPanDaR package.
#>   Please report the issue at <https://github.com/trr266/ExPanDaR/issues>.

prepare_missing_values_graph(russell_3000, ts_id="period", binary = TRUE)