Reads a data frame and prepares a scatter plot.
Arguments
- df
Data frame containing the data
- x
a string containing the column name of the x variable
- y
a string containing the column name of the y variable
- color
a string containing the column name of the variable providing the color aesthetic (can be numerical or a factor)
- size
a string containing the column name of the variable providing the size aesthetic
- loess
a numerical scalar
- 0
No loess curve
- 1
loess curve with equal weights
- 2
loess curve with weights based on
sizevariable
- alpha
The alpha value to be used. If missing, it calculates a default based on the sample size
Examples
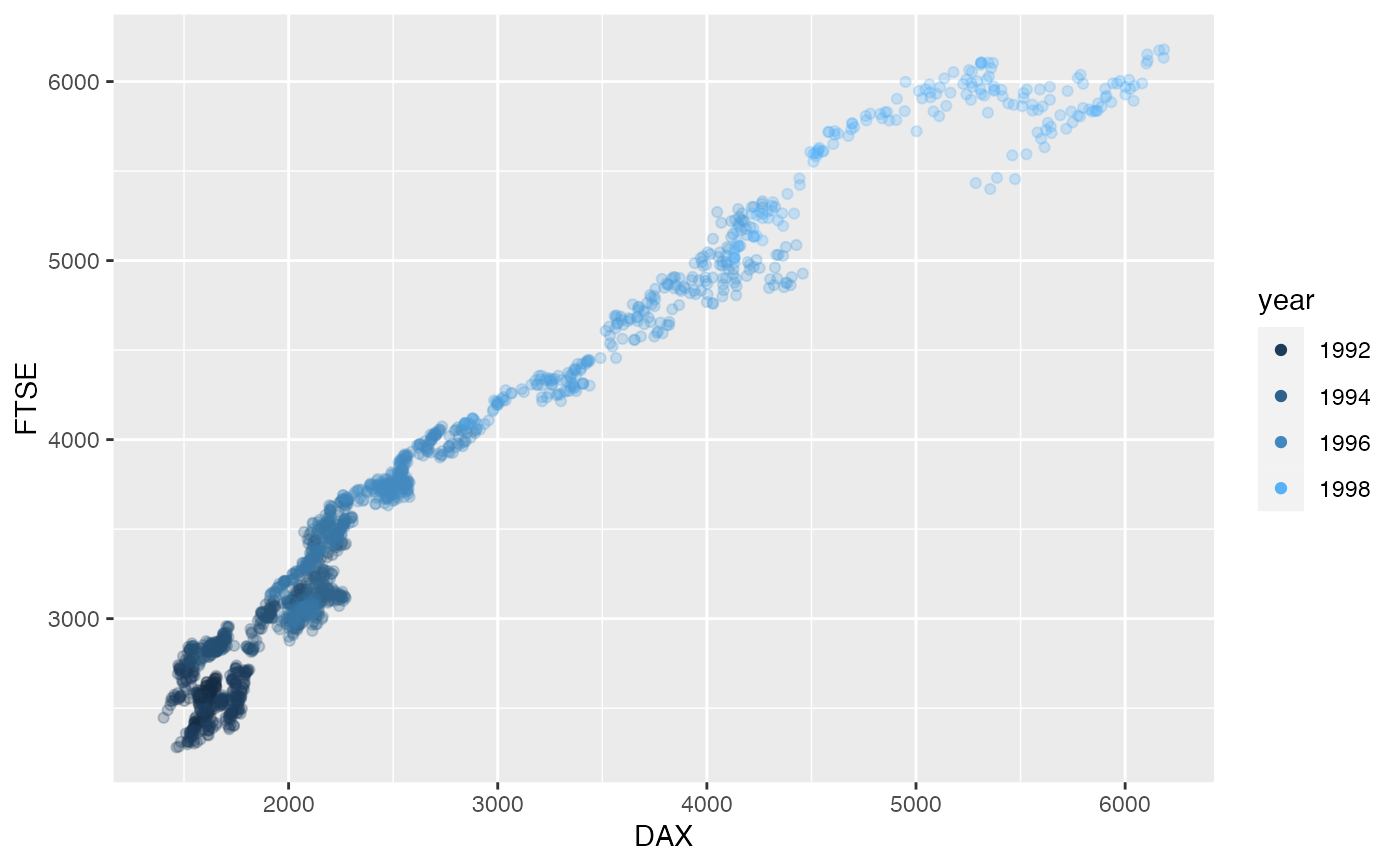
df <- data.frame(year = floor(stats::time(datasets::EuStockMarkets)),
                 datasets::EuStockMarkets[, c("DAX", "FTSE")])
prepare_scatter_plot(df, x="DAX", y="FTSE", color="year")