Reads a data frame and line plots all variables (which need to be numeric) by an ordered factor (normally the time-series indicator).
Arguments
- df
Data frame containing the ordered factor and a set of numerical variables to be plotted
- ts_id
a string containing the column name of the ordered factor (normally the time-series indicator)
- var
a character vector containing the column names of the variables that should be plotted. Defaults to all numeric variables of the data frame besides the one indicated by
ts_id.
Value
A list containing two items:
- "df"
A data frame containing the plotted means and standard errors
- "plot
The plot as returned by
ggplot
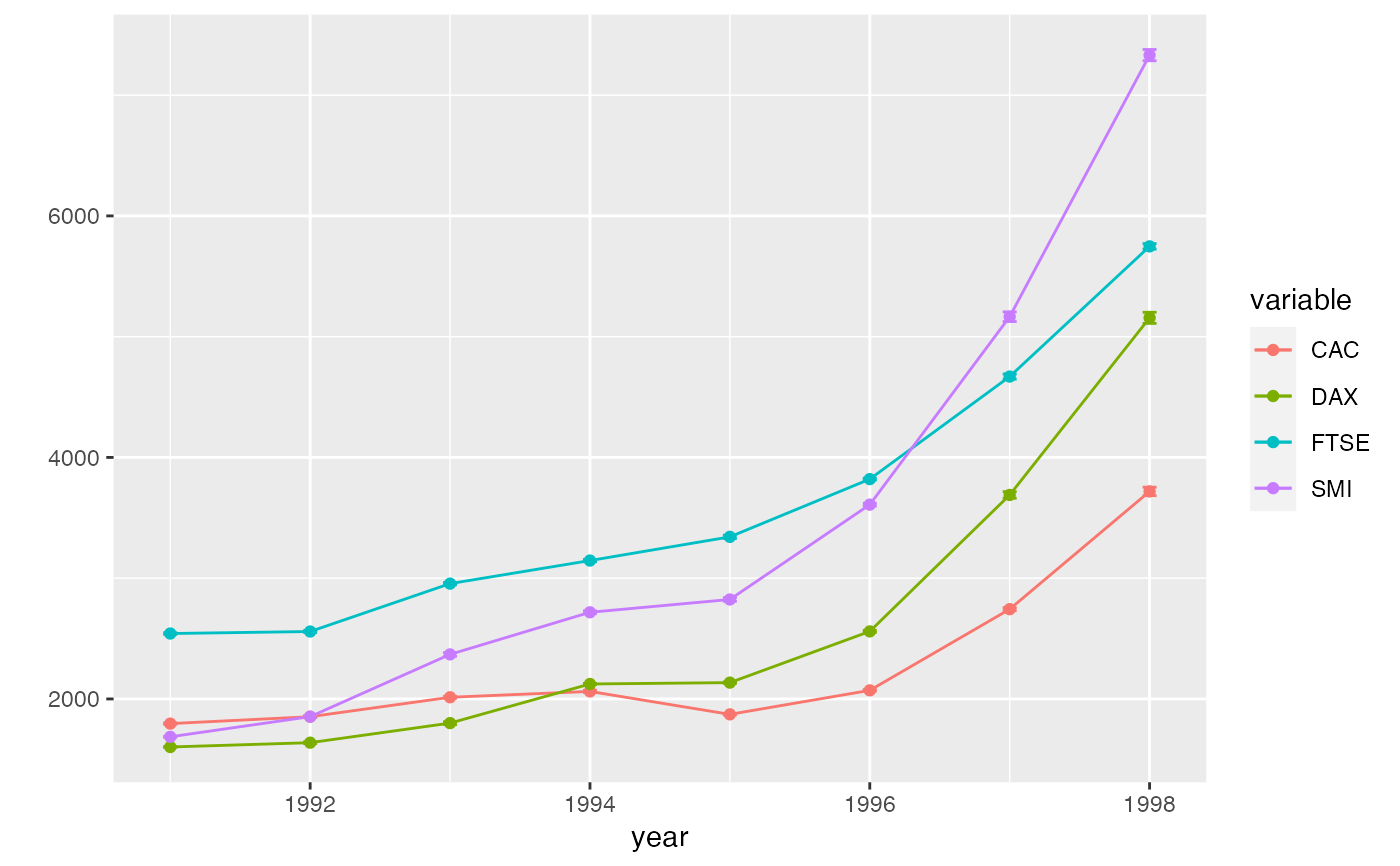
Examples
df <- data.frame(year = floor(time(EuStockMarkets)), EuStockMarkets)
graph <- prepare_trend_graph(df, "year")
graph$plot