Treats numerical outliers either by winsorizing or by truncating.
Arguments
- x
Data that is coercible into a numeric vector or matrix. If it is a data frame then all numerical variables of the data frame are coerced into a matrix.
- percentile
A numeric scalar. The percentile below which observations are considered to be outliers. Is treated symmetrical so that
c(percentile, 1-percentile)are used as boundaries. Defaults to 0.01 and needs to be > 0 and < 0.5.- truncate
A logical scalar. If TRUE then data are truncated (i.e., set to NA if out of bounds). Defaults to FALSE.
- by
NULL or either a factor vector or a character string identifying a factor variable in the data frame provided by x. The factor indicated by 'by' is being used to identify groups by which the outlier treatment is applied. Defaults to NULL (no grouping). If provided, the resulting vector must not contain NAs and needs to be such so that
length(byvec) == nrows(as.matrix(x)).- ...
Additional parameters forwarded to quantile (notably,
type)
Value
A numeric vector or matrix containing the outlier-treated x.
if a data frame was provided in x, a data frame with its numeric variables
replaced by their outlier-treated values.
Details
All members of the numerical matrix are checked for finiteness and are set to NA if they are not finite. NAs are removed when calculating the outlier cut-offs.
Examples
treat_outliers(seq(1:100), 0.05)
#> [1] 5.95 5.95 5.95 5.95 5.95 6.00 7.00 8.00 9.00 10.00 11.00 12.00
#> [13] 13.00 14.00 15.00 16.00 17.00 18.00 19.00 20.00 21.00 22.00 23.00 24.00
#> [25] 25.00 26.00 27.00 28.00 29.00 30.00 31.00 32.00 33.00 34.00 35.00 36.00
#> [37] 37.00 38.00 39.00 40.00 41.00 42.00 43.00 44.00 45.00 46.00 47.00 48.00
#> [49] 49.00 50.00 51.00 52.00 53.00 54.00 55.00 56.00 57.00 58.00 59.00 60.00
#> [61] 61.00 62.00 63.00 64.00 65.00 66.00 67.00 68.00 69.00 70.00 71.00 72.00
#> [73] 73.00 74.00 75.00 76.00 77.00 78.00 79.00 80.00 81.00 82.00 83.00 84.00
#> [85] 85.00 86.00 87.00 88.00 89.00 90.00 91.00 92.00 93.00 94.00 95.00 95.05
#> [97] 95.05 95.05 95.05 95.05
treat_outliers(seq(1:100), truncate = TRUE, 0.05)
#> [1] NA NA NA NA NA 6 7 8 9 10 11 12 13 14 15 16 17 18 19 20 21 22 23 24 25
#> [26] 26 27 28 29 30 31 32 33 34 35 36 37 38 39 40 41 42 43 44 45 46 47 48 49 50
#> [51] 51 52 53 54 55 56 57 58 59 60 61 62 63 64 65 66 67 68 69 70 71 72 73 74 75
#> [76] 76 77 78 79 80 81 82 83 84 85 86 87 88 89 90 91 92 93 94 95 NA NA NA NA NA
# When you like the percentiles calculated like STATA's summary or pctile:
treat_outliers(seq(1:100), 0.05, type = 2)
#> [1] 5.5 5.5 5.5 5.5 5.5 6.0 7.0 8.0 9.0 10.0 11.0 12.0 13.0 14.0 15.0
#> [16] 16.0 17.0 18.0 19.0 20.0 21.0 22.0 23.0 24.0 25.0 26.0 27.0 28.0 29.0 30.0
#> [31] 31.0 32.0 33.0 34.0 35.0 36.0 37.0 38.0 39.0 40.0 41.0 42.0 43.0 44.0 45.0
#> [46] 46.0 47.0 48.0 49.0 50.0 51.0 52.0 53.0 54.0 55.0 56.0 57.0 58.0 59.0 60.0
#> [61] 61.0 62.0 63.0 64.0 65.0 66.0 67.0 68.0 69.0 70.0 71.0 72.0 73.0 74.0 75.0
#> [76] 76.0 77.0 78.0 79.0 80.0 81.0 82.0 83.0 84.0 85.0 86.0 87.0 88.0 89.0 90.0
#> [91] 91.0 92.0 93.0 94.0 95.0 95.5 95.5 95.5 95.5 95.5
df <- data.frame(a = seq(1:1000), b = rnorm(1000), c = sample(LETTERS[1:5], 1000, replace=TRUE))
winsorized_df <- treat_outliers(df)
summary(df)
#> a b c
#> Min. : 1.0 Min. :-2.938978 Length:1000
#> 1st Qu.: 250.8 1st Qu.:-0.686197 Class :character
#> Median : 500.5 Median : 0.008579 Mode :character
#> Mean : 500.5 Mean : 0.004340
#> 3rd Qu.: 750.2 3rd Qu.: 0.666959
#> Max. :1000.0 Max. : 2.755418
summary(winsorized_df)
#> a b c
#> Min. : 10.99 Min. :-2.291499 Length:1000
#> 1st Qu.:250.75 1st Qu.:-0.686197 Class :character
#> Median :500.50 Median : 0.008579 Mode :character
#> Mean :500.50 Mean : 0.003761
#> 3rd Qu.:750.25 3rd Qu.: 0.666959
#> Max. :990.01 Max. : 2.223346
winsorized_df <- treat_outliers(df, 0.05, by="c")
by(df, df$c, summary)
#> df$c: A
#> a b c
#> Min. : 1.0 Min. :-2.93898 Length:211
#> 1st Qu.:195.5 1st Qu.:-0.67253 Class :character
#> Median :424.0 Median : 0.05836 Mode :character
#> Mean :454.5 Mean :-0.01647
#> 3rd Qu.:714.5 3rd Qu.: 0.62014
#> Max. :997.0 Max. : 2.65490
#> ------------------------------------------------------------
#> df$c: B
#> a b c
#> Min. : 4.0 Min. :-2.64521 Length:196
#> 1st Qu.:316.0 1st Qu.:-0.65723 Class :character
#> Median :514.5 Median :-0.03952 Mode :character
#> Mean :522.3 Mean : 0.05547
#> 3rd Qu.:743.5 3rd Qu.: 0.69145
#> Max. :998.0 Max. : 2.75542
#> ------------------------------------------------------------
#> df$c: C
#> a b c
#> Min. : 17.0 Min. :-2.49536 Length:195
#> 1st Qu.:265.5 1st Qu.:-0.85995 Class :character
#> Median :508.0 Median : 0.00851 Mode :character
#> Mean :514.1 Mean :-0.03429
#> 3rd Qu.:752.0 3rd Qu.: 0.81945
#> Max. :986.0 Max. : 2.15876
#> ------------------------------------------------------------
#> df$c: D
#> a b c
#> Min. : 7.0 Min. :-2.80801 Length:188
#> 1st Qu.:240.8 1st Qu.:-0.56325 Class :character
#> Median :489.0 Median : 0.07030 Mode :character
#> Mean :488.9 Mean : 0.04557
#> 3rd Qu.:727.5 3rd Qu.: 0.64076
#> Max. :994.0 Max. : 2.48082
#> ------------------------------------------------------------
#> df$c: E
#> a b c
#> Min. : 2.0 Min. :-2.39020 Length:210
#> 1st Qu.: 264.5 1st Qu.:-0.71428 Class :character
#> Median : 538.0 Median :-0.07711 Mode :character
#> Mean : 524.2 Mean :-0.02350
#> 3rd Qu.: 797.2 3rd Qu.: 0.64704
#> Max. :1000.0 Max. : 2.69237
by(winsorized_df, df$c, summary)
#> df$c: A
#> a b c
#> Min. : 34.0 Min. :-1.86553 Length:211
#> 1st Qu.:195.5 1st Qu.:-0.67253 Class :character
#> Median :424.0 Median : 0.05836 Mode :character
#> Mean :453.8 Mean :-0.01338
#> 3rd Qu.:714.5 3rd Qu.: 0.62014
#> Max. :943.5 Max. : 1.65662
#> ------------------------------------------------------------
#> df$c: B
#> a b c
#> Min. : 71.0 Min. :-1.49200 Length:196
#> 1st Qu.:316.0 1st Qu.:-0.65723 Class :character
#> Median :514.5 Median :-0.03952 Mode :character
#> Mean :523.5 Mean : 0.05128
#> 3rd Qu.:743.5 3rd Qu.: 0.69145
#> Max. :964.5 Max. : 1.80135
#> ------------------------------------------------------------
#> df$c: C
#> a b c
#> Min. : 89.7 Min. :-1.78623 Length:195
#> 1st Qu.:265.5 1st Qu.:-0.85995 Class :character
#> Median :508.0 Median : 0.00851 Mode :character
#> Mean :515.5 Mean :-0.03373
#> 3rd Qu.:752.0 3rd Qu.: 0.81945
#> Max. :950.9 Max. : 1.67637
#> ------------------------------------------------------------
#> df$c: D
#> a b c
#> Min. : 51.35 Min. :-1.47564 Length:188
#> 1st Qu.:240.75 1st Qu.:-0.56325 Class :character
#> Median :489.00 Median : 0.07030 Mode :character
#> Mean :488.28 Mean : 0.04023
#> 3rd Qu.:727.50 3rd Qu.: 0.64076
#> Max. :933.25 Max. : 1.47381
#> ------------------------------------------------------------
#> df$c: E
#> a b c
#> Min. : 52.6 Min. :-1.49300 Length:210
#> 1st Qu.:264.5 1st Qu.:-0.71428 Class :character
#> Median :538.0 Median :-0.07711 Mode :character
#> Mean :523.9 Mean :-0.03049
#> 3rd Qu.:797.2 3rd Qu.: 0.64704
#> Max. :944.6 Max. : 1.53394
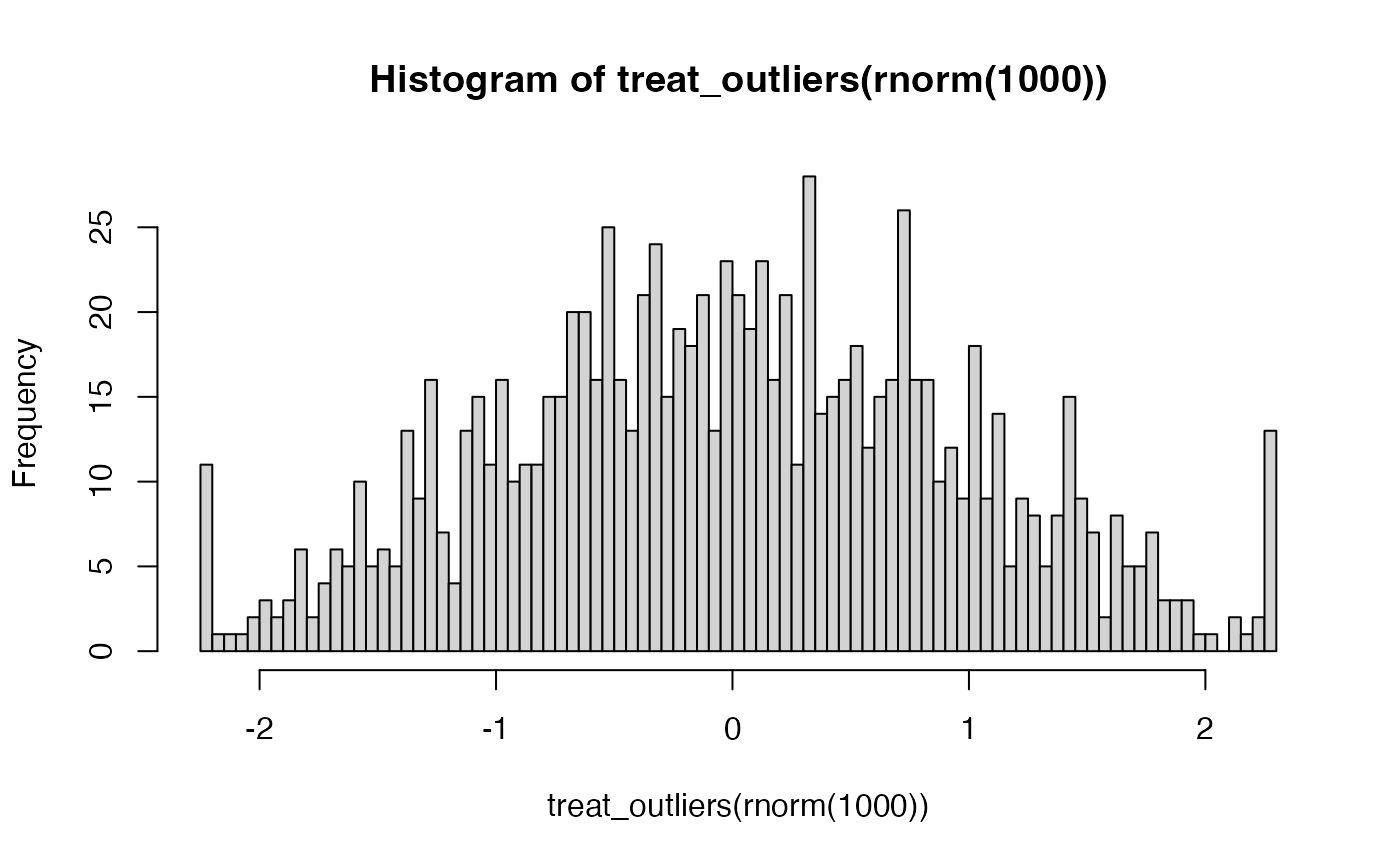
hist(treat_outliers(rnorm(1000)), breaks=100)