Prepares a by Group Violin Graph
Source:R/prepare_by_group_violin_graph.R
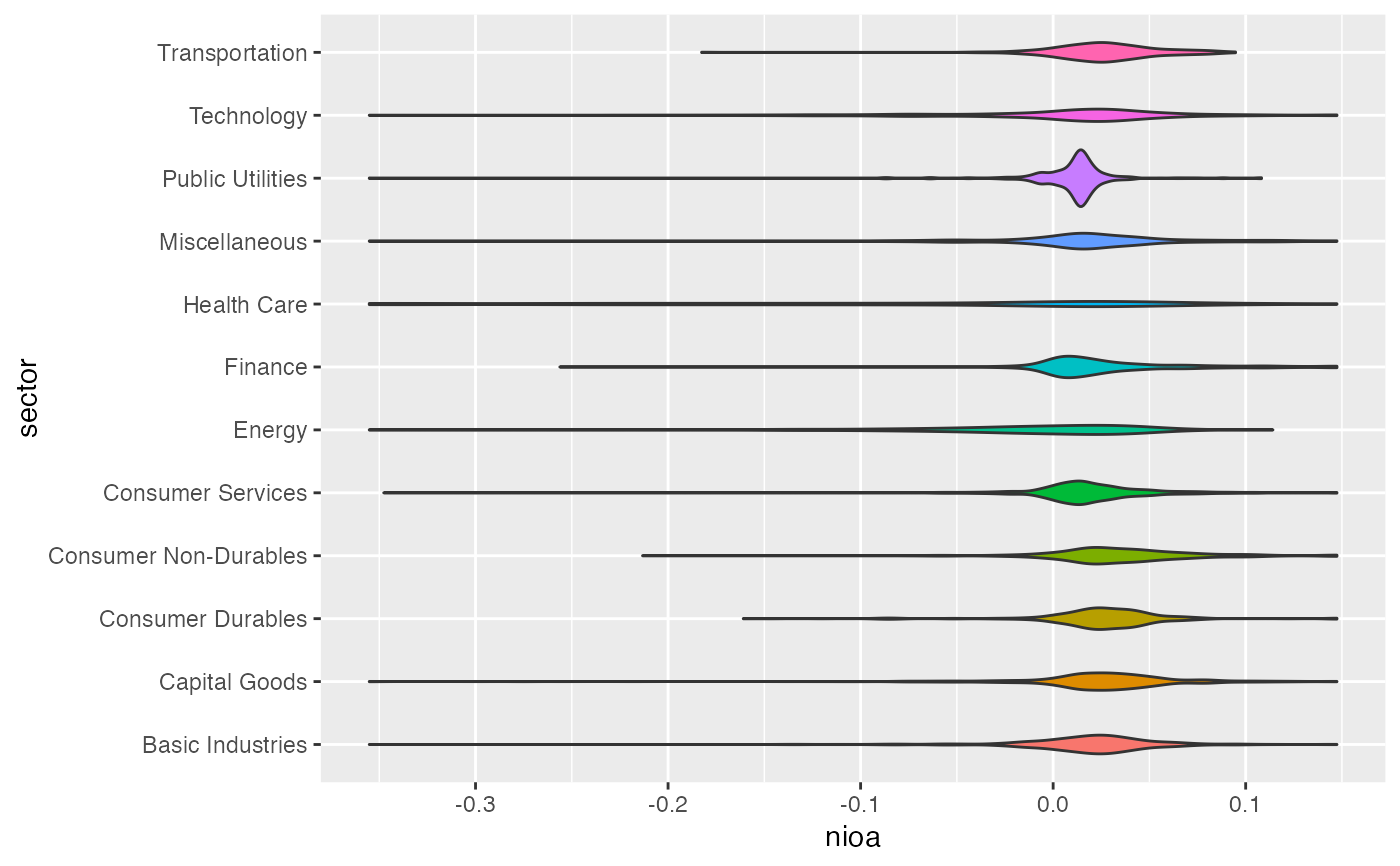
prepare_by_group_violin_graph.RdReads a data frame containing a grouping factor and a numerical variable and plots a series of violin graphs by the grouping factor.
Usage
prepare_by_group_violin_graph(
  df,
  by_var,
  var,
  order_by_mean = FALSE,
  group_on_y = TRUE,
  ...
)
Arguments
- df
Data frame containing the grouping factor and the numerical variable to be plotted
- by_var
a string containing the column name of the grouping factor
- var
a string containing the column name of the numerical variable
- order_by_mean
a logical value indicating whether you want your violins to be ordered by group means (defaults to FALSE)
- group_on_y
a logical value indicating whether you want your violins to be oriented horizontally (defaults to TRUE)
- ...
additional parameters that are passed to
geom_violin
Examples
data(russell_3000)
df <- treat_outliers(russell_3000)
prepare_by_group_violin_graph(df, "sector", "nioa")
#> Warning: The `<scale>` argument of `guides()` cannot be `FALSE`. Use "none" instead as
#> of ggplot2 3.3.4.
#> ℹ The deprecated feature was likely used in the ExPanDaR package.
#>   Please report the issue at <https://github.com/trr266/ExPanDaR/issues>.